DAX 40, S&P 500, Nikkei 225 – Prices, Charts, and Analysis
DAX 40 hits a new peak
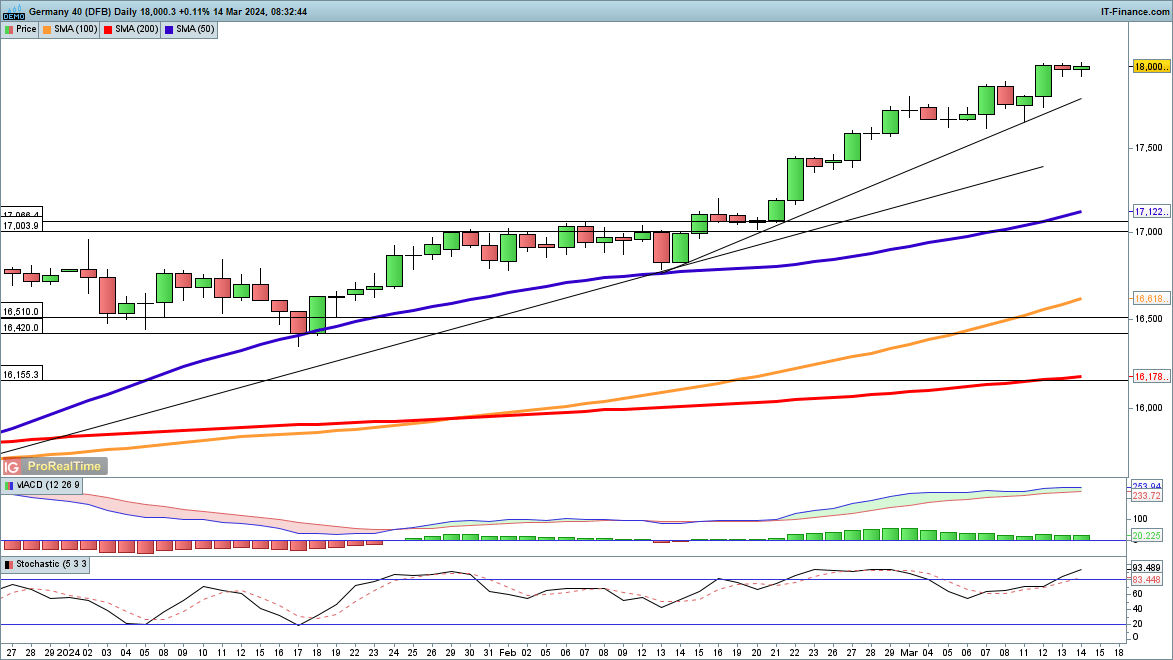
The index hit a new record high in early trading on Thursday, extending its rally and widening the gap with the 50-day simple moving average (SMA). For the moment, it seems like the Dax’s steady progression higher will continue. In the short term, trendline support from mid-February is close by and then comes trendline support from October.
A move back to the 50-day SMA would mark a 5% drop from current levels and would feel like a dramatic event given the current gentle rally.
DAX40 Daily Price Chart
Retail trader data shows 12.89% of traders are net-long with the ratio of traders short to long at 6.76 to 1. The number of traders net-long is 25.39% higher than yesterday and 7.83% lower than last week, while the number of traders net-short is 0.73% lower than yesterday and 3.02% lower than last week.
We typically take a contrarian view to crowd sentiment, and the fact traders are net-short suggests Germany 40 prices may continue to rise.
| Change in | Longs | Shorts | OI |
| Daily | 36% | 1% | 7% |
| Weekly | 19% | 0% | 4% |
S&P 500 targets new highs
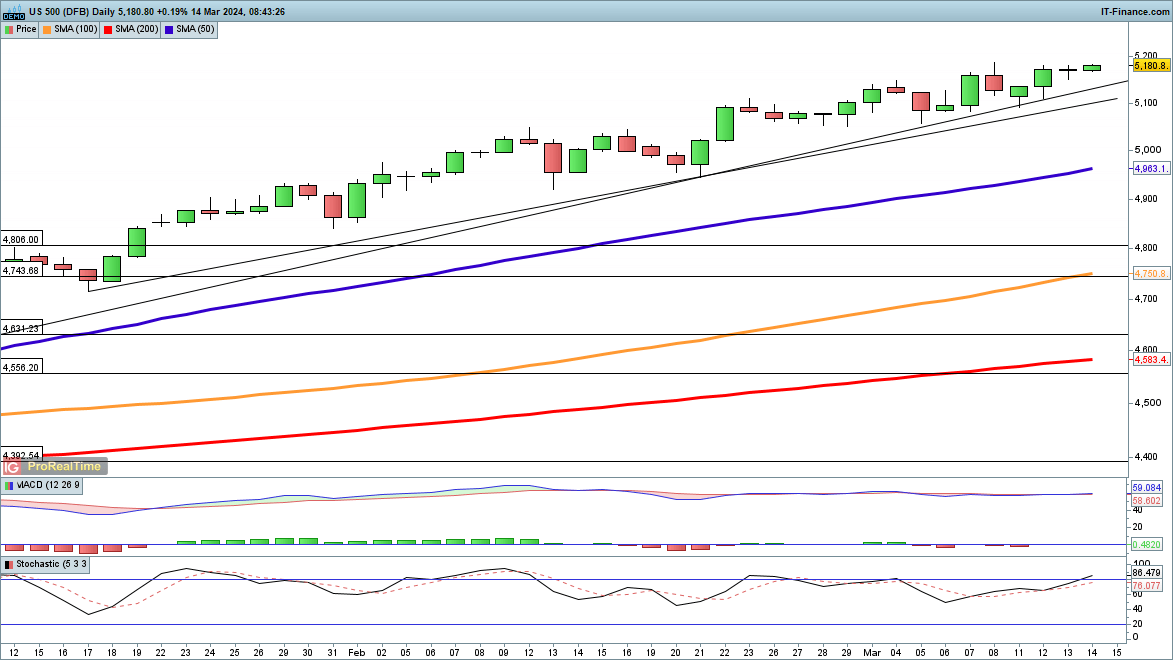
Early trading has seen futures push back to record highs for the index, as the quiet rally continues once more. Indeed, this has been the case all year, and those hoping for a pullback have been continually disappointed. This will not go on forever, but as yet there is no sign of a pullback.
The price continues to trade above trendline support from both early January and the October low. If these are broken, then a pullback may develop.
S&P500 Daily Price Chart
Recommended by Chris Beauchamp
Traits of Successful Traders
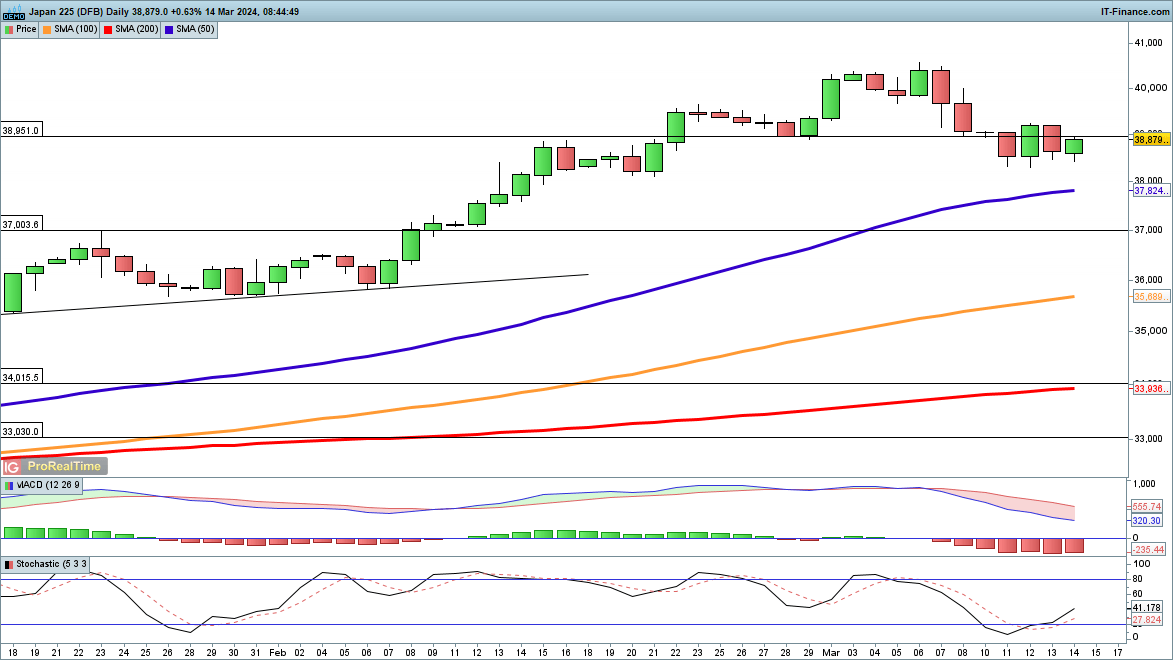
Nikkei 225 pullback halted
The pullback from the highs has been stayed for now, buyers are entering around 38,300.A close back above Tuesday’s high at 39,220 might help to suggest that the pullback has run its course, though with the Bank of Japan decision next week some skittishness may persist.


