Crude Oil Prices and Analysis
- US benchmark crude is closing in on $79/barrel again
- OPEC has stuck with its relatively bullish medium-term demand forecasts
- US stockpiles unexpectedly shrank last week
Learn how to trade oil with our complimentary trading guide
Recommended by David Cottle
How to Trade Oil
Crude Oil Prices rose sharply on Wednesday as the markets mulled over some rather bullish demand forecasts from the Organization of Petroleum Exporting Countries released in the previous session.
The major producers’ group predicts substantial global oil demand growth in the years ahead. It stuck with its previous view that 2024 will see overall increases of 2.5 million barrels per day, with a 1.85 million barrel increase next year.
It is notable that OPEC is a little more optimistic than other oil-watchers, notably the International Energy Agency which expects more subdued demand. Some economists feel that substantial increases in production from non-OPEC sources, notably the United States, will offset the effects of production cuts from traditional producers.
But oil markets have also been lifted by news of a surprise fall in US crude stockpiles last week, and by the latest United States inflation numbers. These showed some key measures of inflation edging up, but perhaps not by enough to elbow aside market expectations that the Federal Reserve could start cutting interest rates in the second half of this year.
Add in the ongoing conflict in Ukraine and Gaza, with the latter’s knock-on effects on global shipping, and it’s perhaps unsurprising that oil prices should remain elevated.
The oil market and all others will have plenty of chances to gauge US economic temperature this week, with producer price, retail sales, and consumer sentiment numbers all still to come. Friday will also bring more market-specific data with the release of the US oil rig count from oil-field services giant Baker Hughes.
For now the West Texas Intermediate benchmark is still struggling with selling pressure on approaches to the $80 mark.
US Crude Oil Technical Analysis
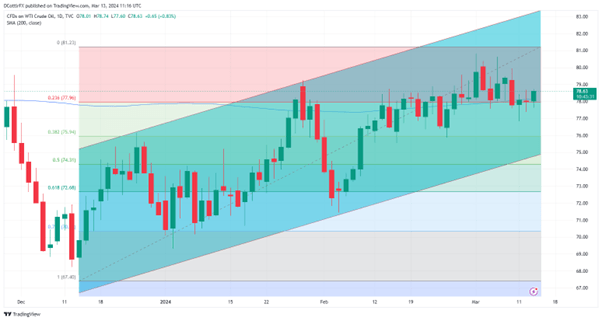
Chart Compiled Using TradingView
Prices remain within a very broad uptrend channel from their lows of mid-December but that channel hasn’t faced a serious upside test since January 29 and there are some signs that the bulls now have work to do if they’re going to prevent this market from topping out, at least in the near term.
Prices attempted to gap higher at the start of this month, but since then have faltered notably on approaches to the $80 psychological resistance mark. Now they are starting to look a little less comfortable around $79 as well.
A trading band between last week’s high of $80.84 and the first Fibonacci retracement of the climb up to it from the mid-December lows at $77.60 seems to be bounding the market and it will probably be instructive to see which way this channel eventually breaks. Bears have made forays below the base on an intraday basis but so far those falls are reclaimed in short order.
More serious reversals would likely find support in the mid $75 area, around another retracement prop at $75.58.
Recommended by David Cottle
Traits of Successful Traders
–By David Cottle for DailyFX

