Most Read: US Dollar Eyes US PCE for Cues on Fed Path; EUR/USD, USD/CAD, USD/JPY Setups
Gold prices lost ground on Monday following a strong performance last Friday, pressured by rising U.S. Treasury yields – a situation that generally diminishes the appeal of the non-interest-bearing asset relative to fixed-income securities. In this context, XAU/USD finished the session around $2,030, slightly below a confluence resistance zone near $2,035.
Many investors appeared to adopt a wait-and-see approach on the precious metal at the start of the new week, refraining from making large directional bets for fear of being caught on the wrong side of the trade. This cautious sentiment was likely attributed to an important event on the U.S. economic calendar on Thursday: the release of the core PCE deflator, the Fed’s favorite inflation gauge.
Forecasts suggest January’s core PCE increased 0.4% month-over-month, resulting in a slight deceleration of the annual reading from 2.9% to 2.8%. However, traders should brace for the possibility of an upside surprise in the data, echoing the trends observed in the CPI and PPI surveys disclosed earlier this month. This could inject volatility into financial markets.
For an extensive analysis of gold’s fundamental and technical outlook, download our complimentary quarterly trading forecast now!
Recommended by Diego Colman
Get Your Free Gold Forecast
UPCOMING US ECONOMIC DATA
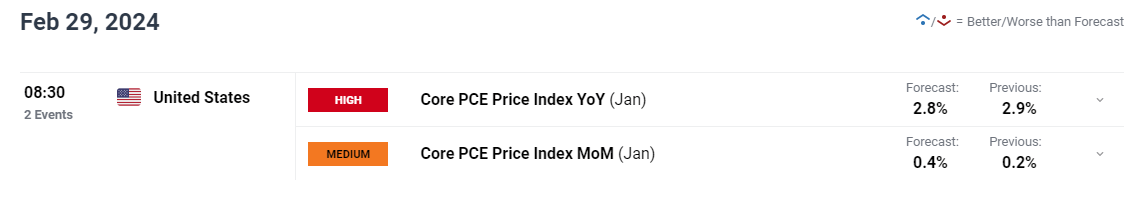
Source: DailyFX Economic Calendar
A red-hot PCE report showing stagnating progress in disinflation could push interest rate expectations in a hawkish direction on bets that the central bank would be compelled to delay the start of its easing cycle in response to setbacks in efforts to achieve price stability. This scenario should be bullish for yields and the US dollar, but would pose challenges for the precious metals complex.
Wondering how retail positioning can shape gold prices? Our sentiment guide provides the answers you are looking for—don’t miss out, get the guide now!
Recommended by Diego Colman
Get Your Free Gold Forecast
GOLD PRICE TECHNICAL ANALYSIS
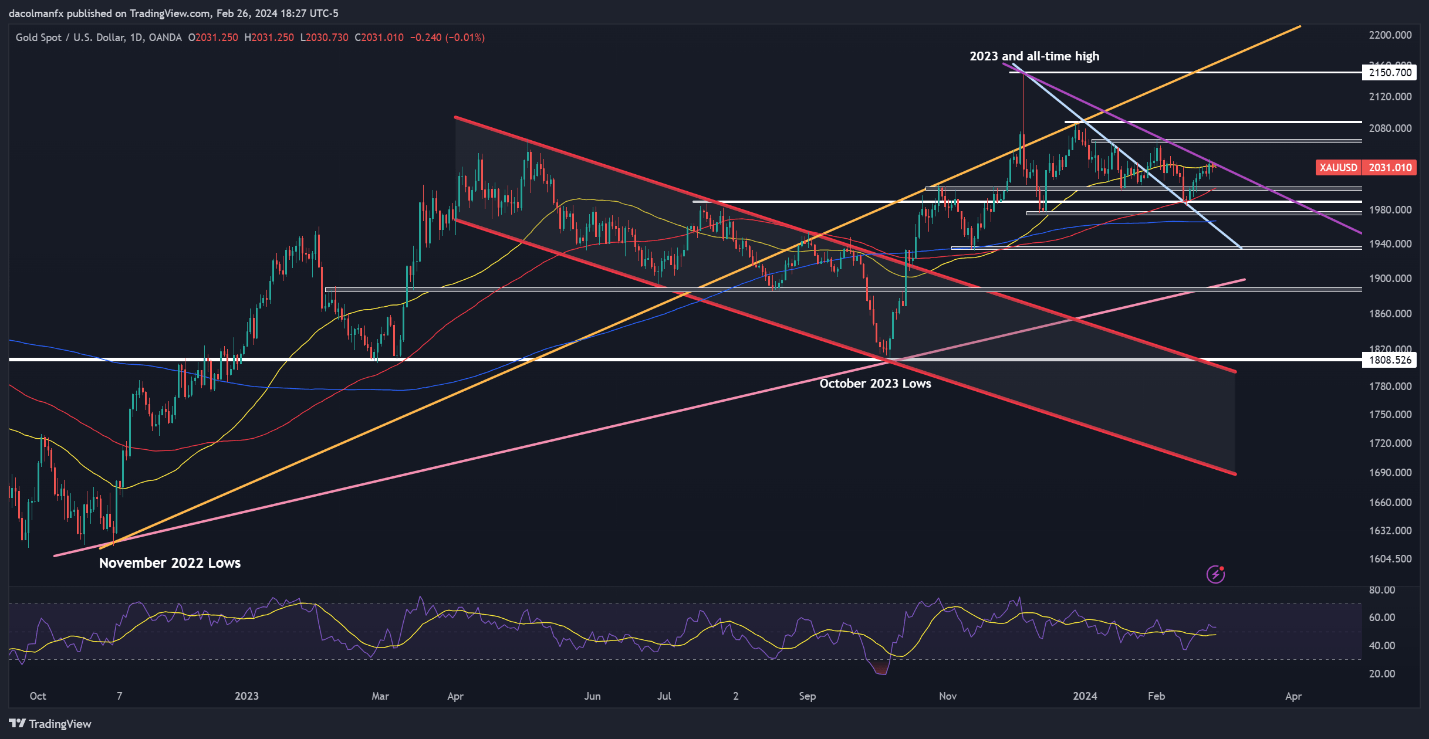
Gold prices pivoted lower on Monday after failing to clear the $2,035 zone – an area of confluence resistance where a downtrend line converges with the 50-day simple moving average. If this bearish rejection is confirmed in the days ahead, a pullback towards $2,005 could be on the horizon. On further weakness, attention will be on $1,990, followed by $1,995.
On the flip side, if buyers regain decisive command of the market and trigger a breakout beyond $2,035, bullish impetus may gather pace, reinforcing the upward thrust and laying the groundwork for a rally towards $2,065. Additional gains past this juncture might bring focus to $2,090 and subsequently $2,150—the all-time high.
GOLD PRICE (XAU/USD) CHART