
XRP price started a downside correction from the $0.580 resistance. The price could start a fresh rally unless there is a close below the $0.535 support.
- XRP is struggling to clear the $0.5650 and $0.580 resistance levels.
- The price is now trading above $0.535 and the 100 simple moving average (4 hours).
- There is a key bullish trend line forming with support at $0.5350 on the 4-hour chart of the XRP/USD pair (data source from Kraken).
- The pair could start a fresh rally unless there is a close below the $0.535 support.
XRP Price Dips To Key Support
In the past few days, XRP price recovered higher from the $0.520 zone. There was a move above the $0.535 and $0.550 resistance levels. However, the bears remained active near the $0.580 resistance and protected more upsides, like Bitcoin and Ethereum.
The recent high was formed at $0.5792 before there was a downside correction. There was a move below the $0.550 level. The price even tested the $0.535 support. A low is formed near $0.5322 and the price is now consolidating losses.
Ripple’s token price is now trading above $0.535 and the 100 simple moving average (4 hours). There is also a key bullish trend line forming with support at $0.5350 on the 4-hour chart of the XRP/USD pair. On the upside, immediate resistance is near the $0.5550 zone. It is close to the 50% Fib retracement level of the downward move from the $0.5793 swing high to the $0.5322 low.
The first key resistance is near $0.5620 or the 61.8% Fib retracement level of the downward move from the $0.5793 swing high to the $0.5322 low, above which the price could rise toward the $0.580 resistance. A close above the $0.580 resistance zone could spark a strong increase.
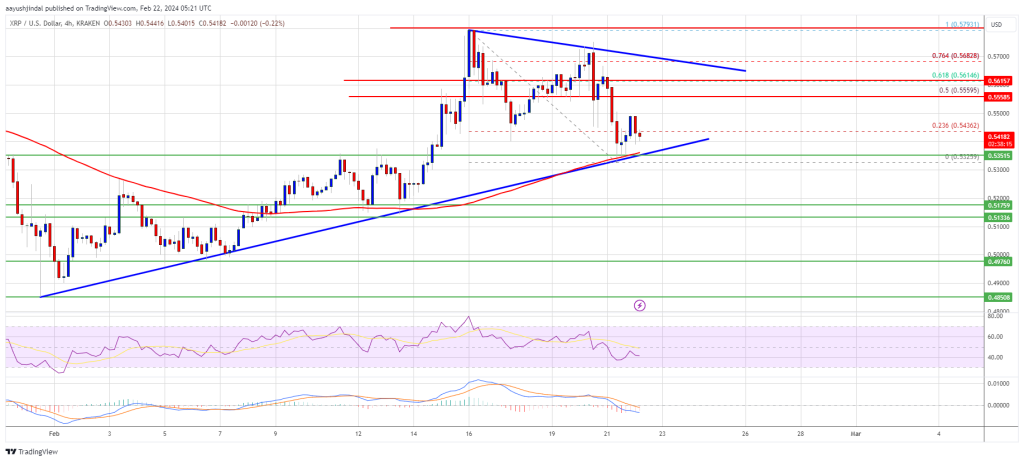
Source: XRPUSD on TradingView.com
The next key resistance is near $0.600. If the bulls remain in action above the $0.600 resistance level, there could be a rally toward the $0.620 resistance. Any more gains might send the price toward the $0.650 resistance.
Another Decline?
If XRP fails to clear the $0.5550 resistance zone, it could start another decline. Initial support on the downside is near the $0.535 zone and the trend line.
The next major support is at $0.5220. If there is a downside break and a close below the $0.5220 level, the price might accelerate lower. In the stated case, the price could retest the $0.480 support zone.
Technical Indicators
4-Hours MACD – The MACD for XRP/USD is now losing pace in the bearish zone.
4-Hours RSI (Relative Strength Index) – The RSI for XRP/USD is now below the 50 level.
Major Support Levels – $0.535, $0.522, and $0.480.
Major Resistance Levels – $0.555, $0.565, and $0.580.
Disclaimer: The article is provided for educational purposes only. It does not represent the opinions of NewsBTC on whether to buy, sell or hold any investments and naturally investing carries risks. You are advised to conduct your own research before making any investment decisions. Use information provided on this website entirely at your own risk.