GOLD PRICE OUTLOOK:
- Gold prices (XAU/USD) rally vigorously, reaching their highest level since late December
- However, these gains might be at risk of reversal next week if U.S. jobs data surprises higher
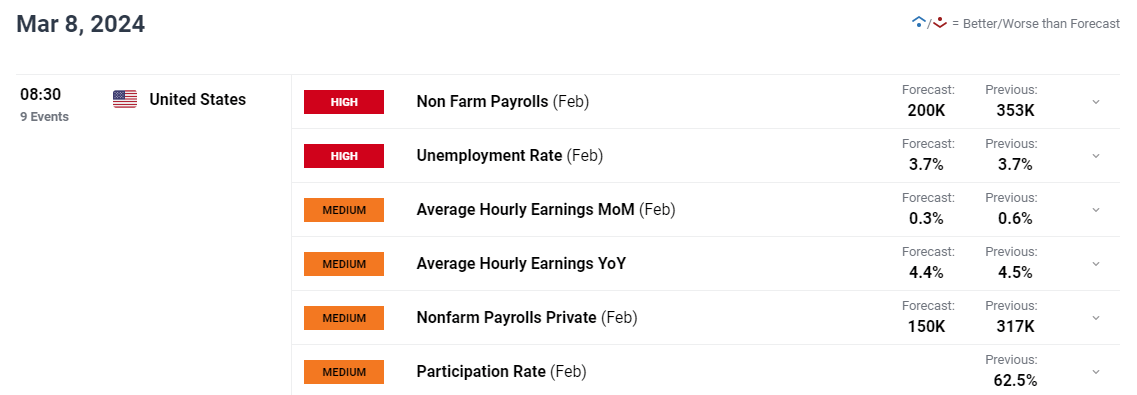
- The February U.S. nonfarm payrolls report is scheduled to be released on Friday morning
Most Read: USD/JPY Recovers on Ueda’s Dovish Remarks, Critical Tech Levels Ahead
Gold prices (XAU/USD) staged a remarkable rally this past week, breaking past key technical thresholds to reach their highest point since December 2023. By Friday’s close, the precious metal had notched a substantial weekly gain of 2.33%, settling near $2,082.
Bullion’s bullish momentum can be attributed in part to a moderate pullback in U.S. Treasury yields, a reaction triggered by two significant economic reports that left investors pondering their implications for the Federal Reserve’s monetary policy stance.
To start, January’s core PCE deflator came in at 0.4% m/m and 2.8% y/y, meeting consensus estimates. Wall Street, rattled by recent CPI and PPI data, had been bracing for another upside inflation surprise, but was relieved when the FOMC‘s preferred price gauge landed precisely on its expected mark.
Eager to gain insights into gold’s future path? Discover the answers in our complimentary quarterly trading guide. Request a copy now!
Recommended by Diego Colman
Get Your Free Gold Forecast
Adding to the narrative, disappointing manufacturing PMI (ISM) figures showed an accelerated contraction last month, reinforcing the retreat in yields. Traders speculated that weak factory sector output may lead the U.S. central bank to start easing its stance earlier than initially envisioned.
Looking ahead, traders should be attentive to the upcoming February U.S. jobs data for insights into the market’s trajectory. A blockbuster report mirroring January’s robust numbers would undermine hopes of an early Fed pivot toward rate cuts, potentially sending gold prices tumbling.
On the other hand, if nonfarm payrolls figures underwhelm projections and hint at mounting economic headwinds, interest rate expectations are likely to recalibrate toward a more dovish outlook, weighing on yields. This scenario is poised to support precious metals.
UPCOMING US JOBS REPORT
Wondering how retail positioning can shape gold prices? Our sentiment guide provides the answers you are looking for—don’t miss out, get the guide now!
| Change in | Longs | Shorts | OI |
| Daily | -11% | 7% | -2% |
| Weekly | -16% | 24% | 1% |
GOLD PRICE (XAU/USD) TECHNICAL ANALYSIS
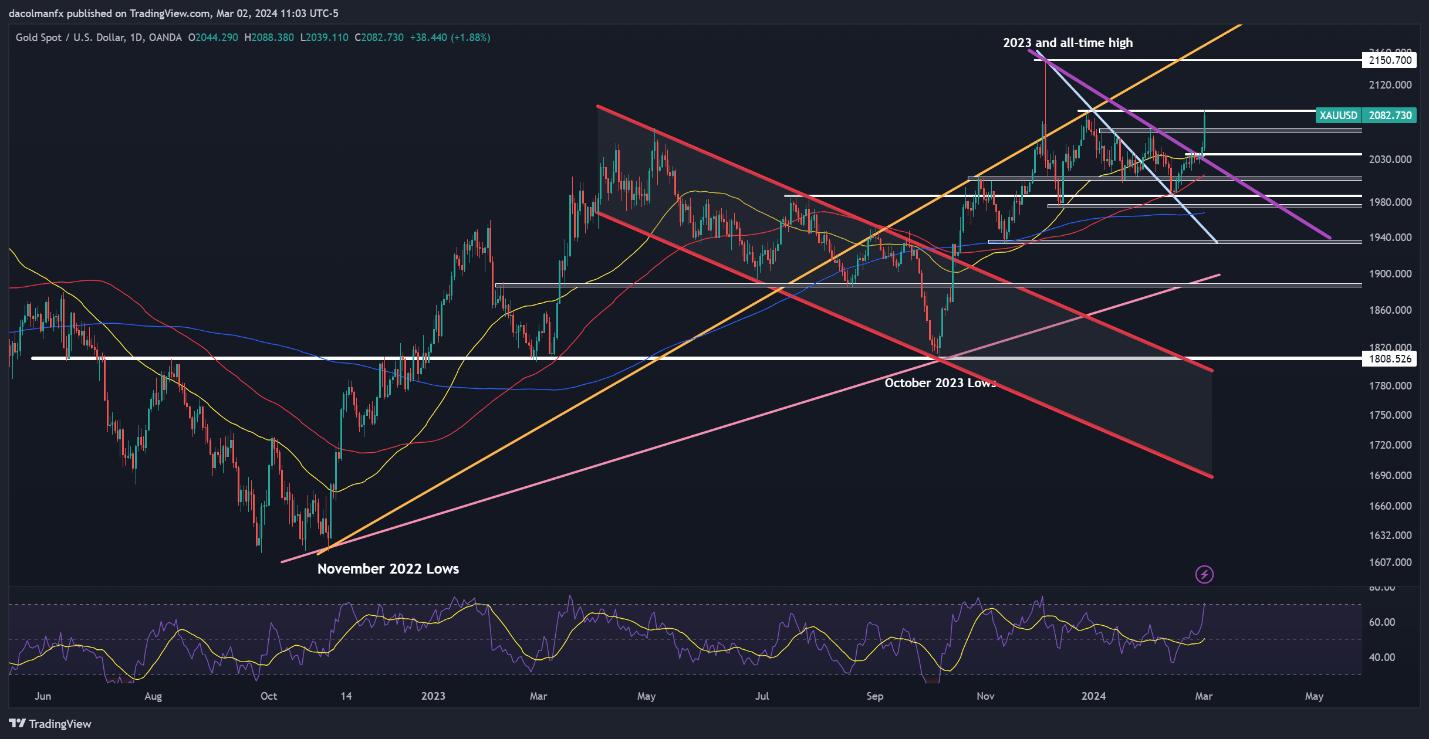
Gold surged beyond trendline resistance at $2,035 and breached another key ceiling at $2,065 this past week, edging closer to surpassing late December’s swing high around $2,085. Failure by bears to contain the price at this point might trigger a rally toward the yellow metal’s record in the vicinity of $2,150.
On the flip side, if sellers stage a comeback and spark a bearish reversal, initial support appears at $2,065. Further losses below this level could lead to a retracement towards the 50-day simple moving average at $2,035. If weakness persists, attention will turn to the $2,010/$2,005 range.
GOLD PRICE TECHNICAL CHART