GBP/USD, FTSE 100 Prices, Analysis, and Charts
- A dovish BoE sends GBP-pairs tumbling.
- UK government bond yields eye multi-week lows.
- FTSE 100 posts a fresh one-year high.
Most Read: Bank of England Leaves Rates Unchanged, Vote Split Turns Dovish, GBP/USD Slips
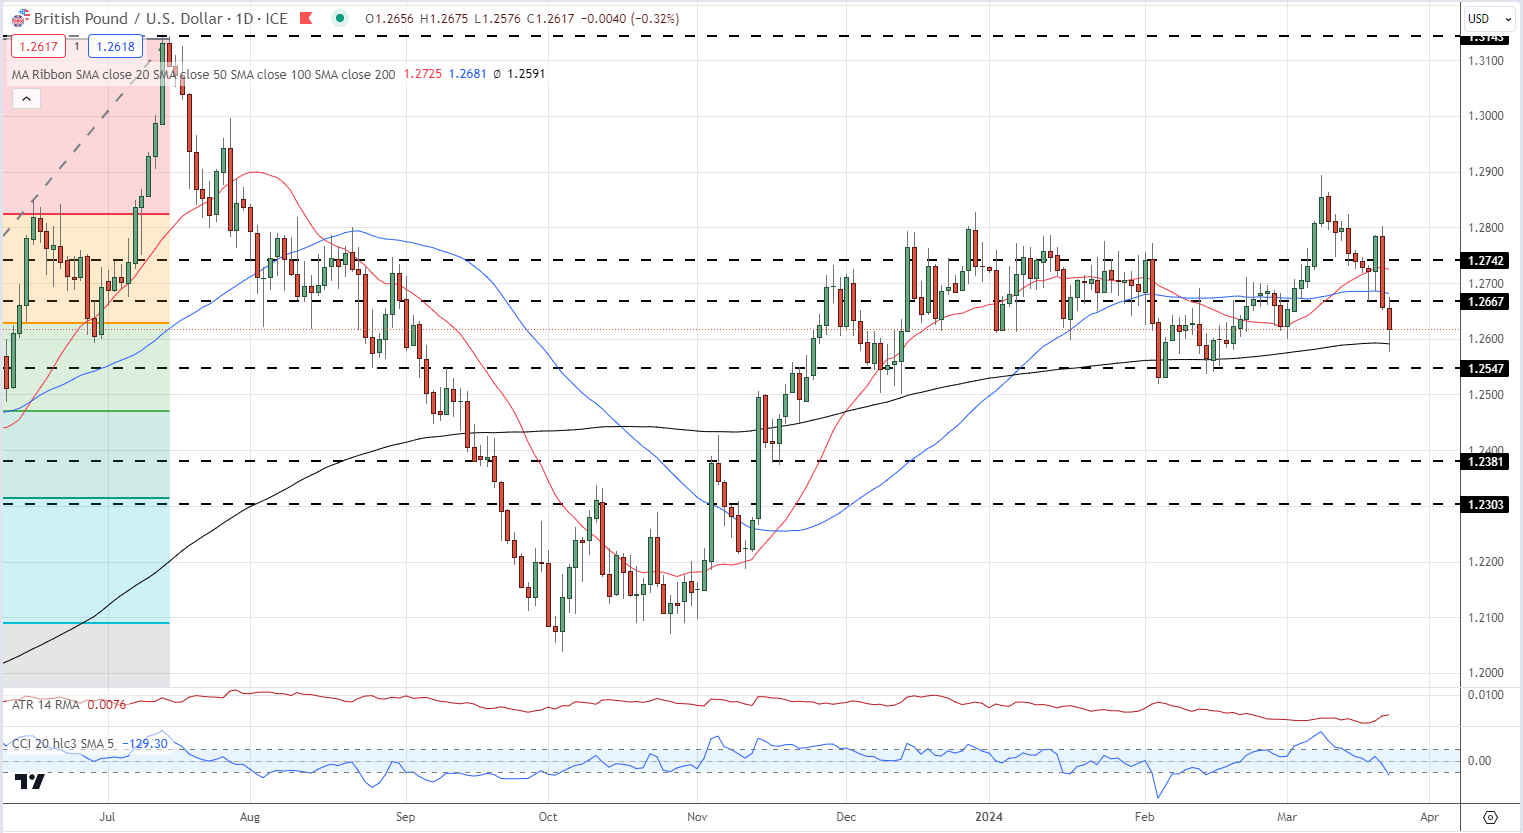
GBP/USD is trading around lows last seen one month ago after the Bank of England gave a strong hint that they may start cutting interest rates in June. Going into the meeting, market forecasts pointed at the August meeting for the first UK Bank Rate cut, but this changed rapidly after the MPC meeting on Thursday. GBP/USD fell from a high of 1.2800 to around 1.2650 and this sell-off has continued as we go into the weekend. Sterling is currently trying to find a balance against the US dollar, and this will be made harder next week due to a lack of any important events or data releases, and a UK Bank Holiday on the Friday. Support is seen at 1.2591 (200day sma), 1.2547, and then the 50% Fib retracement at 1.2471.
For all market-moving economic data and events, see the DailyFX Economic Calendar
Learn how to use economic data and events to help your trading
Recommended by Nick Cawley
Introduction to Forex News Trading
GBP/USD Daily Price Chart
IG Retail data shows 64.55% of GBP/USD traders are net-long with the ratio of traders long to short at 1.82 to 1.The number of traders net-long is 39.00% higher than yesterday and 21.10% higher from last week, while the number of traders net-short is 29.34% lower than yesterday and 30.53% lower from last week.
We typically take a contrarian view to crowd sentiment, and the fact traders are net-long suggests GBP/USD prices may continue to fall.
See How Changes in IG Client Sentiment Can Help Your Trading Decisions
| Change in | Longs | Shorts | OI |
| Daily | 8% | -9% | 1% |
| Weekly | 25% | -28% | 0% |
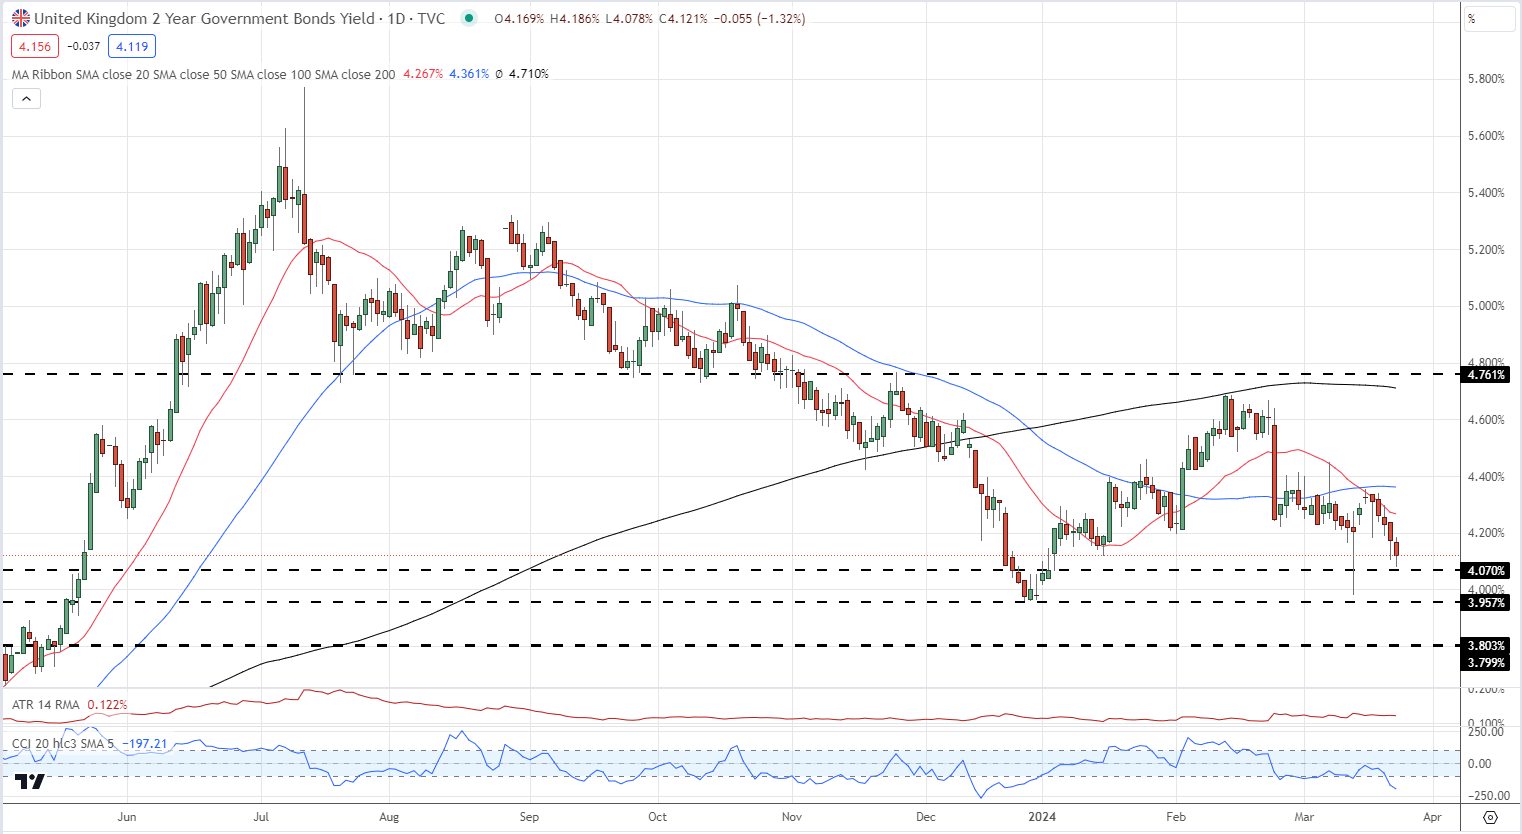
UK government bond yields also fell sharply post-BoE as traders began pricing in lower UK borrowing costs. The rate-sensitive UK 2-year gilt opened this week with a yield of 4.35% before drifting lower into the meeting. This move lower accelerated yesterday and today with the yield touching a low of 4.08%. The chart suggests a break below 4.07% brings a near-term target of 3.96% into focus.
UK 2-Year Gilt Yield
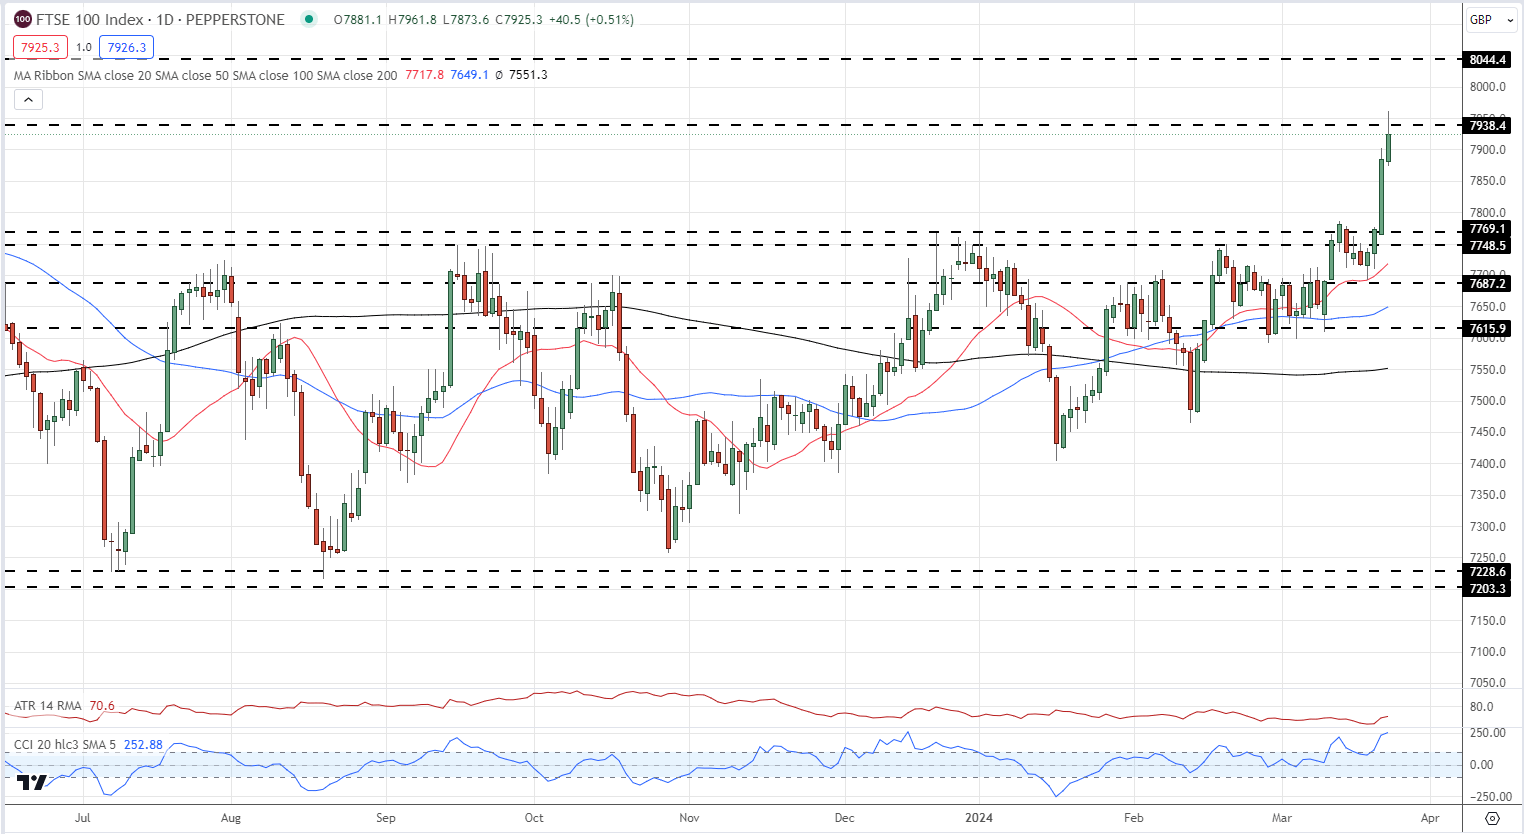
The FTSE 100 had a much better week as a weaker rate backdrop saw traders push the indices to a new one-year high. A weaker GBP/USD also helped fuel the move, boosting profits of FTSE 100 companies that earn US dollars abroad. With GBP/USD unlikely to push higher in the short term, the FTSE 100 will push higher. The FTSE 100 all-time high of 8044 is set to come under pressure in the weeks ahead.
FTSE 100 Daily Chart
What is your view on the British Pound, Gilt yields, and the FTSE 100 – bullish or bearish?? You can let us know via the form at the end of this piece or you can contact the author via Twitter @nickcawley1.