
Bitcoin price rallied further above $62,000. BTC is now consolidating gains and might soon attempt another upward move toward the $64,000 resistance.
- Bitcoin price is consolidating gains below the $60,000 resistance zone.
- The price is trading above $60,500 and the 100 hourly Simple moving average.
- There is a connecting bullish trend line forming with support at $60,950 on the hourly chart of the BTC/USD pair (data feed from Kraken).
- The pair could extend its current rally toward the $64,000 resistance zone.
Bitcoin Price Jumps Over $5K
Bitcoin price remained strong above the $58,000 resistance zone. BTC formed a fresh support base and started another rally. It gained over 10% and broke many hurdles near $60,000 and $62,000.
The price even surged toward the $64,000 level. A new multi-week high was formed near $64,000 before there was a sharp decline after the Coinbase outage. The price dived toward the $58,000 support zone. A low was formed near $57,919 and the price started a fresh rally.
It is back above the $60,000 resistance. There was a move above the 50% Fib retracement level of the downward move from the $64,000 swing high to the $57,919 low.
Bitcoin is now trading above $60,000 and the 100 hourly Simple moving average. There is also a connecting bullish trend line forming with support at $60,950 on the hourly chart of the BTC/USD pair. Immediate resistance is near the $62,500 level. It is near the 76.4% Fib retracement level of the downward move from the $64,000 swing high to the $57,919 low.
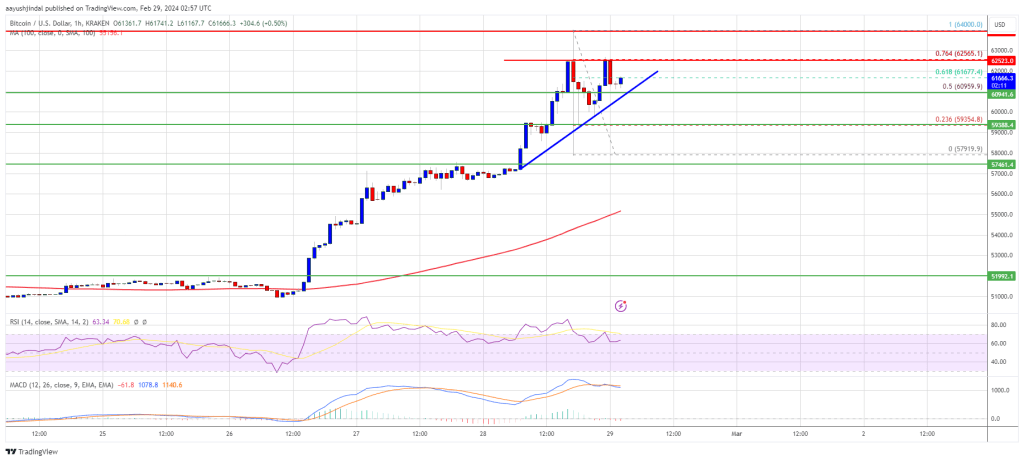
Source: BTCUSD on TradingView.com
The next key resistance could be $64,000, above which the price could rise toward the $65,000 resistance zone. If the bulls remain in action, the price could even surpass $65,000 and test $66,400. The main hurdle for them is visible near the $68,000 zone.
Are Dips Supported In BTC?
If Bitcoin fails to rise above the $62,500 resistance zone, it could start a downside correction. Immediate support on the downside is near the $60,800 level and the trend line.
The first major support is $60,000. If there is a close below $60,000, the price could start a decent pullback toward the $58,000 zone. Any more losses might send the price toward the $56,500 support zone.
Technical indicators:
Hourly MACD – The MACD is now gaining pace in the bullish zone.
Hourly RSI (Relative Strength Index) – The RSI for BTC/USD is now above the 50 level.
Major Support Levels – $60,800, followed by $60,000.
Major Resistance Levels – $62,500, $64,000, and $65,000.
Disclaimer: The article is provided for educational purposes only. It does not represent the opinions of NewsBTC on whether to buy, sell or hold any investments and naturally investing carries risks. You are advised to conduct your own research before making any investment decisions. Use information provided on this website entirely at your own risk.