
Bitcoin (BTC) Prices, Charts, and Analysis:
- Bitcoin prints a new ATH then slumps by $5k
- Crypto-relates stocks suffer reversals of differing degrees.
Recommended by Nick Cawley
Get Your Free Introduction To Cryptocurrency Trading
The Next Bitcoin Halving Event – What Does it Mean?
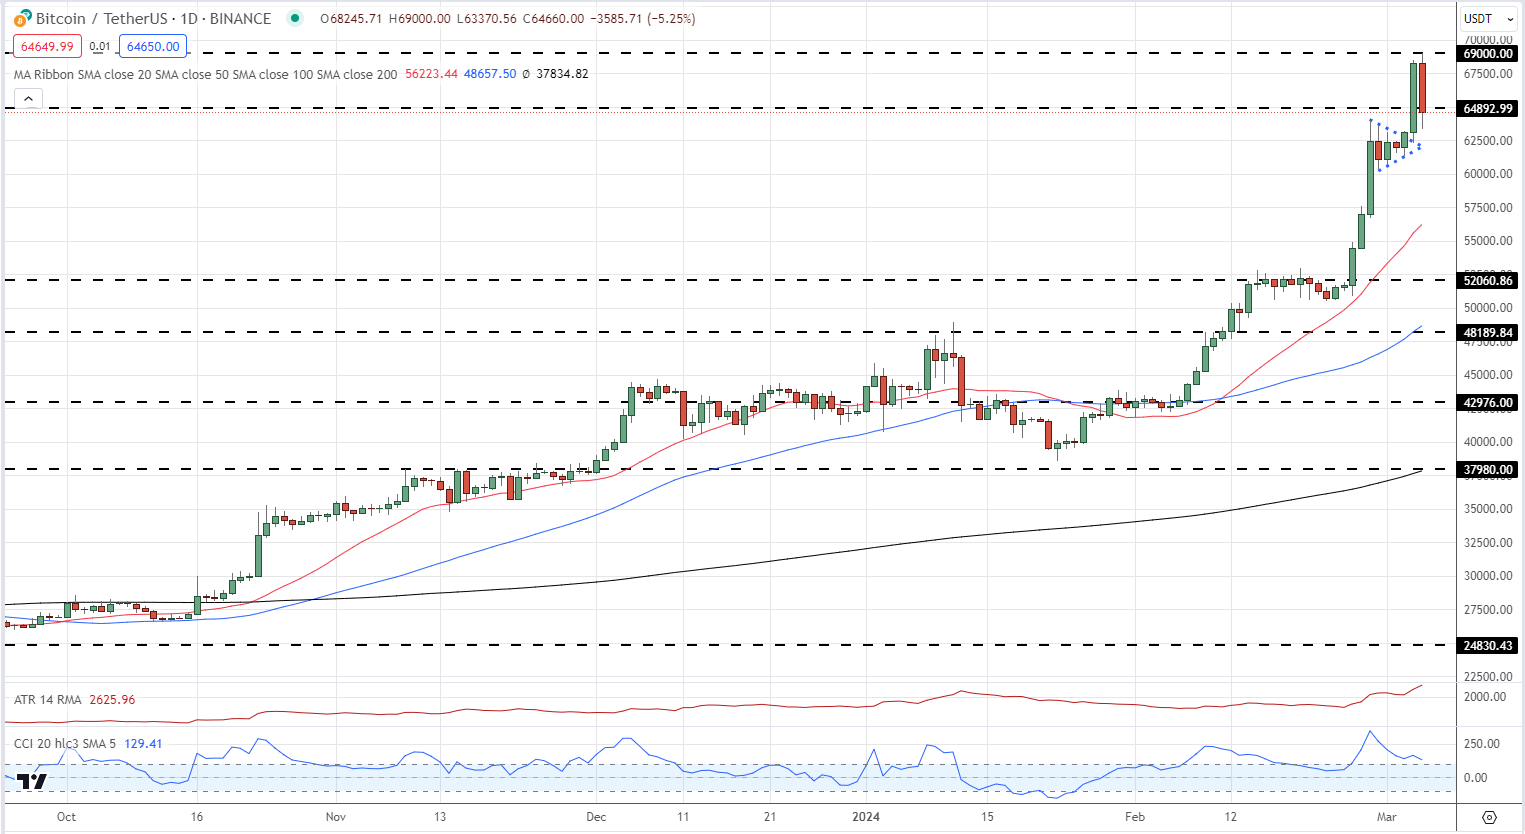
Bitcoin tagged a fresh all-time high mid-afternoon before turning sharply lower as sellers sent the market spiraling lower. The tagging of the ATH saw a wave of sellers appear with market commentary suggesting that selling by recent leveraged long positions accelerated the move lower. Currently, Bitcoin is within yesterday’s trading range, but a break and open below yesterday’s low at $62.3k may see the market sell off further. On the positive side, demand from Bitcoin ETF providers remains strong, underpinning BTC, while the recent bullish pennant pattern remains intact and suggests higher prices.
Pennant Patterns: Trading Bearish and Bullish Pennants
Bitcoin Daily Price Chart
Recommended by Nick Cawley
Get Your Free Bitcoin Forecast
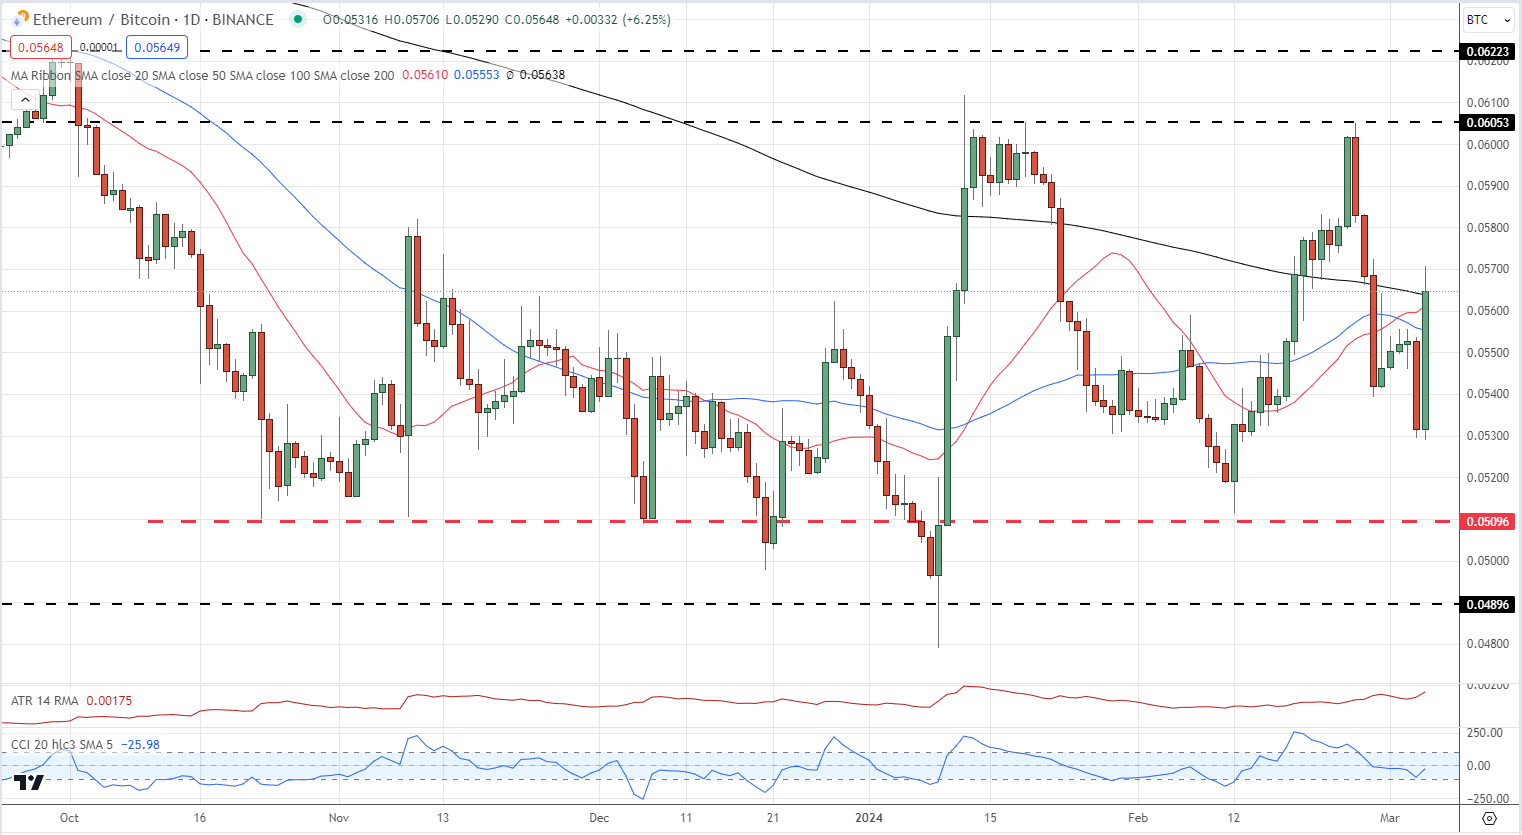
Ethereum is also off its high today but has outperformed Bitcoin by around 6%. While Bitcoin has rallied on spot ETF buying since mid-January, a handful of spot Ethereum ETFs are still waiting for the SEC’s decision. The SEC recently pushed back against Ethereum ETFs proposed by BlackRock and Fidelity and markets are awaiting the SEC’s decision on the VanEck Ethereum ETF that has its final decision deadline on May 23rd. If the VanEck ETH is approved, the SEC will likely approve the rest of the ETF filings to prevent a ‘first mover’ advantage, as it did with the Bitcoin ETFs.
Ethereum Spot ETF – The Next Cab Off the Rank?
Ethereum/Bitcoin Daily Spread Chart
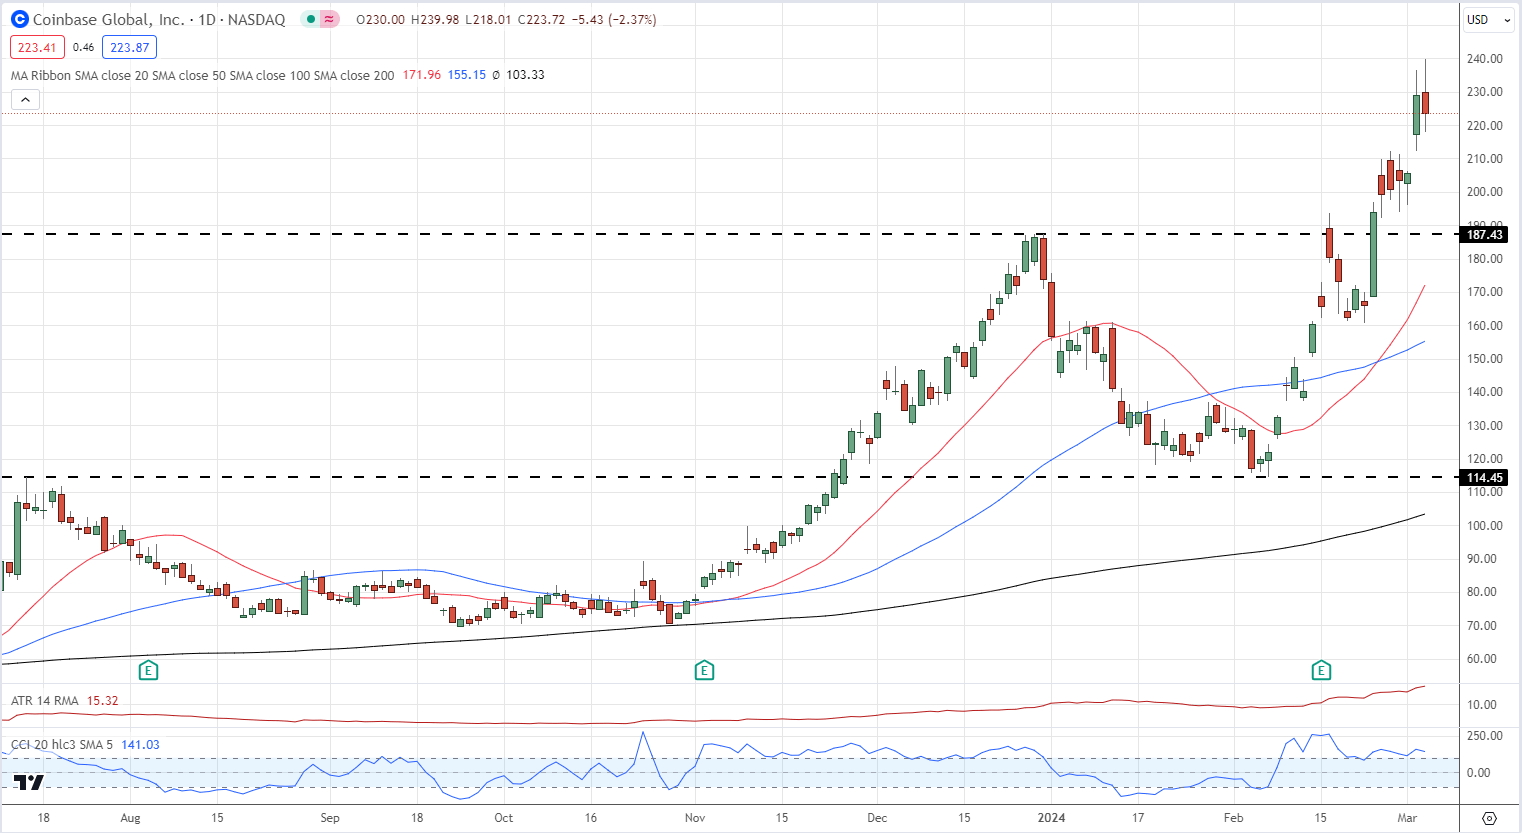
Crypto-related stocks were not immune to the sell-off with losses of varying degrees recorded. After making a multi-month high yesterday, Coinbase has given back around 2.5% so far today…
Coinbase (COIN) Daily Chart
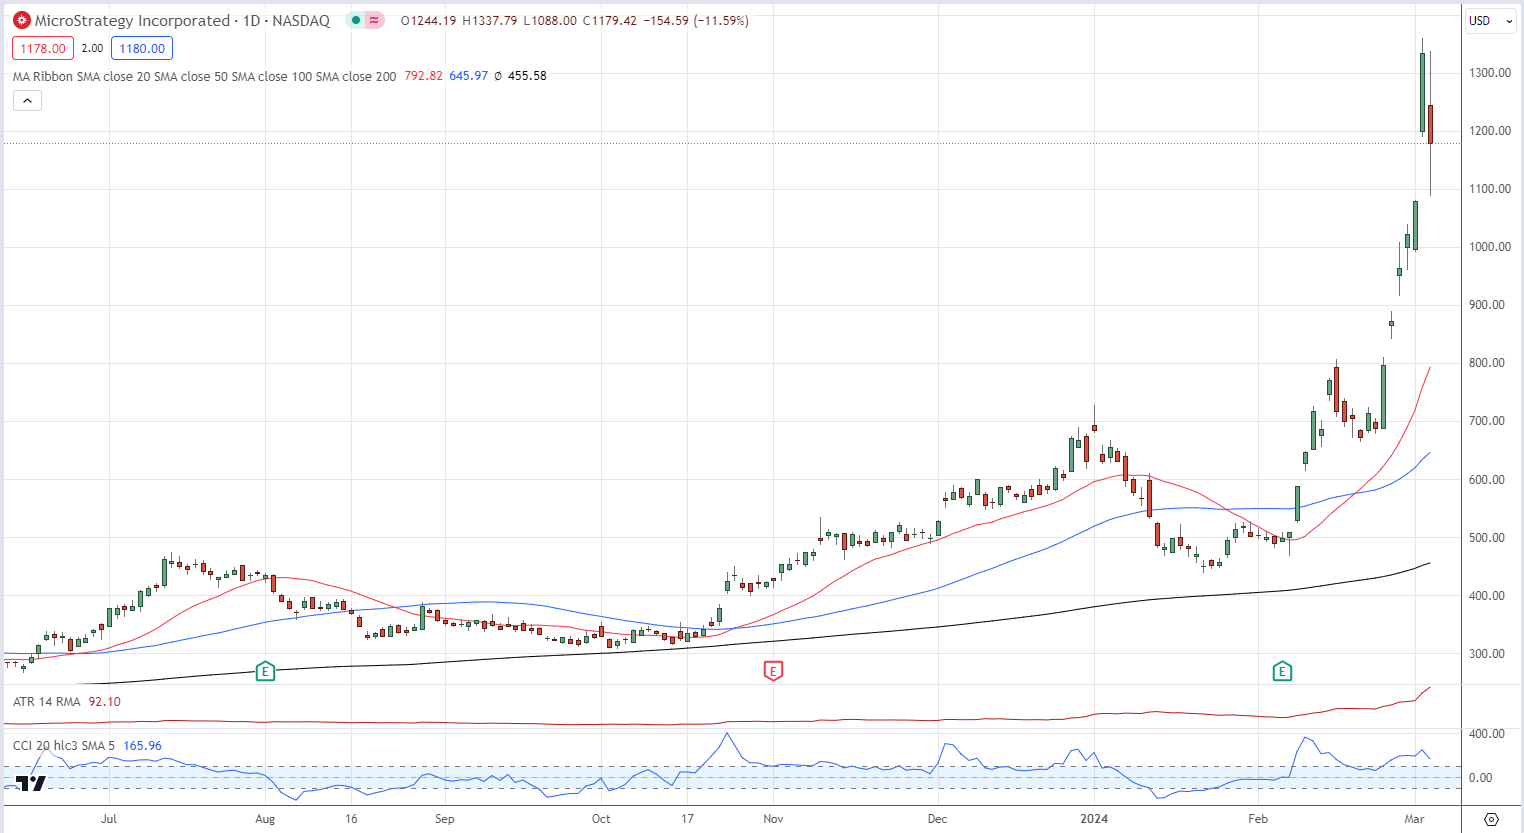
…while MicroStrategy slumped by over 11%, again from a multi-month high. For context, MicroStrategy is still up nearly 75% since the start of the year…
MicroStrategy (MSTR) Daily Chart
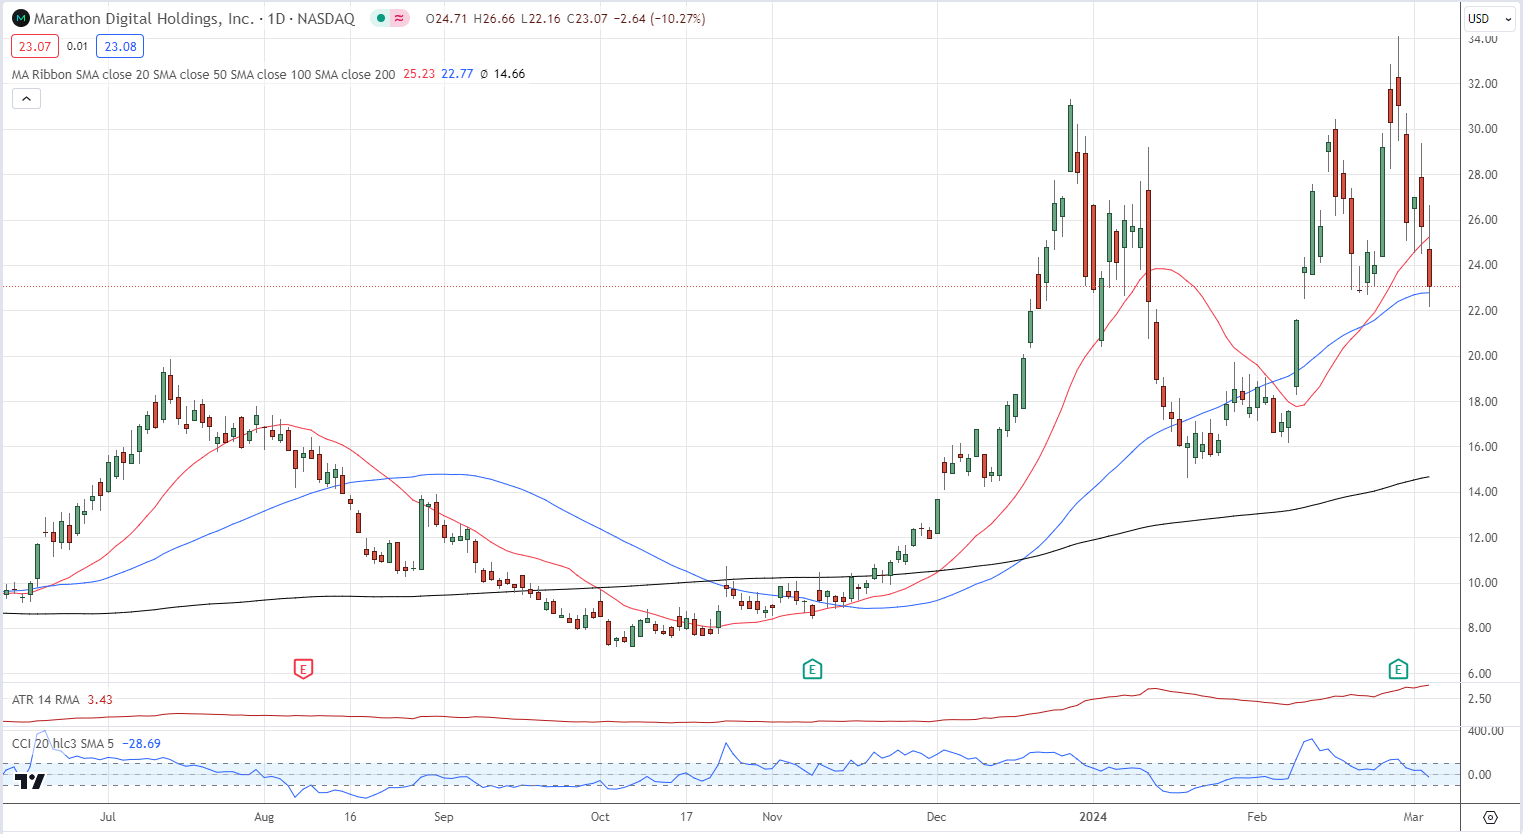
…while Bitcoin Miner Marathon Digital Holdings is down 10% on the session so far and roughly flat on the year.
Marathon Digital Holdings (MARA) Daily Chart
All charts via TradingView
What is your view on the cryptocurrency space – bullish or bearish?? You can let us know via the form at the end of this piece or you can contact the author via Twitter @nickcawley1.