FTSE 100, Dow Jones, Nasdaq 100 Prices and Charts
FTSE 100 back at December highs
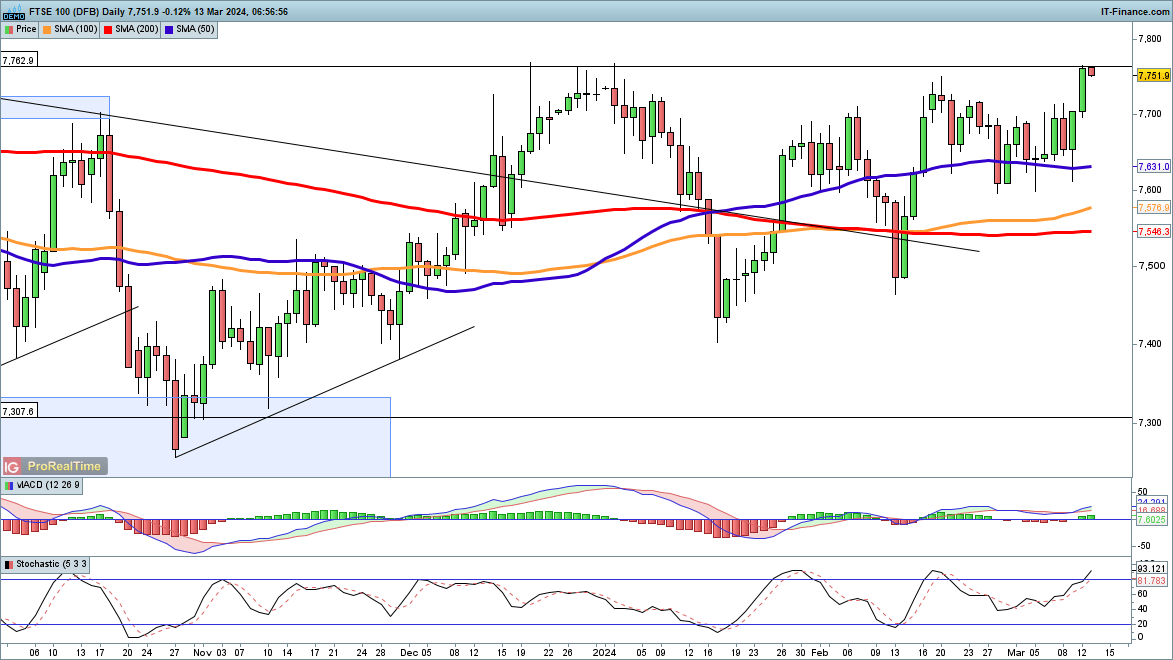
Two days of gains have carried the price back towards the 7770 highs from December. The past two weeks have seen the index rally off 7600, establishing a higher low. The index may now continue to push higher, with a near-term target being 7800.
FTSE 100 Daily Chart
| Change in | Longs | Shorts | OI |
| Daily | 3% | 8% | 6% |
| Weekly | -33% | 55% | 12% |
Dow moves higher despite US inflation data
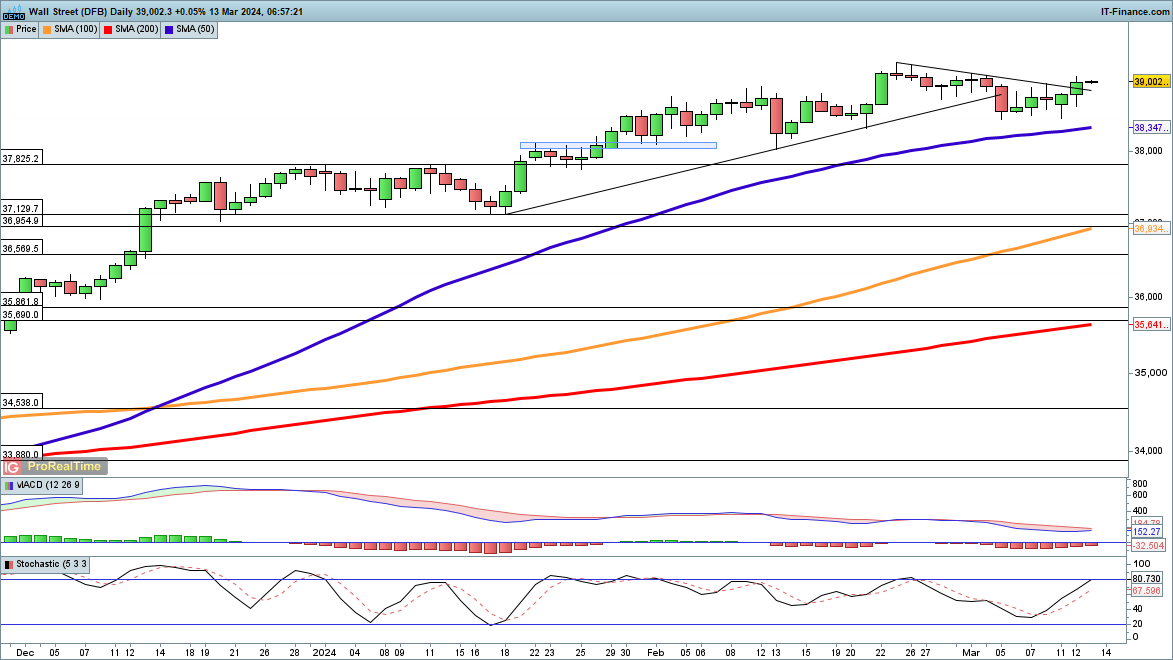
The stronger-than-expected US CPI reading failed to halt the Dow’s advance, with the price breaking through trendline resistance from the February highs.This could now set the stage for a move back to those record highs, and potentially higher. Support has appeared around 38,500, while below this the 50-day simple moving average has yet to be tested.
Dow Jones Daily Chart
Recommended by Chris Beauchamp
Building Confidence in Trading
Nasdaq 100 moves back above 18,000
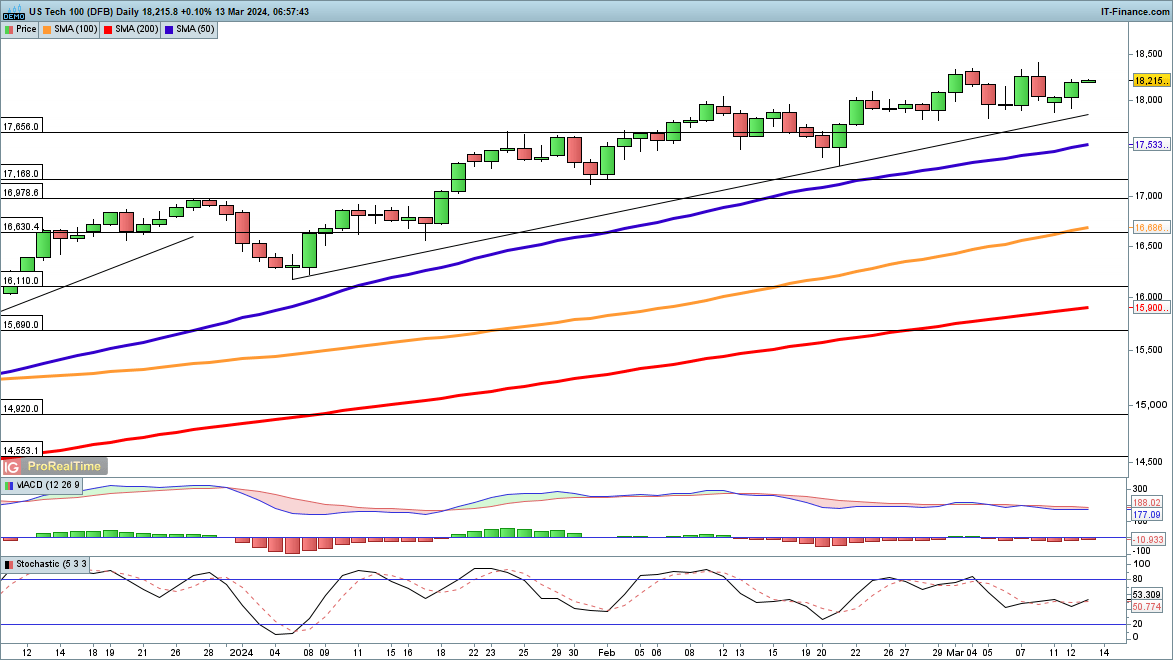
The price has pushed back above 18,000, and a move to a new record seems likely.The move comes despite a higher CPI figure than expected. For the moment support from early January continues to provide an underpinning for further gains.


