FTSE 100, DAX 40, Nikkei 225 Charts and Analysis
FTSE 100 flirts with resistance zone
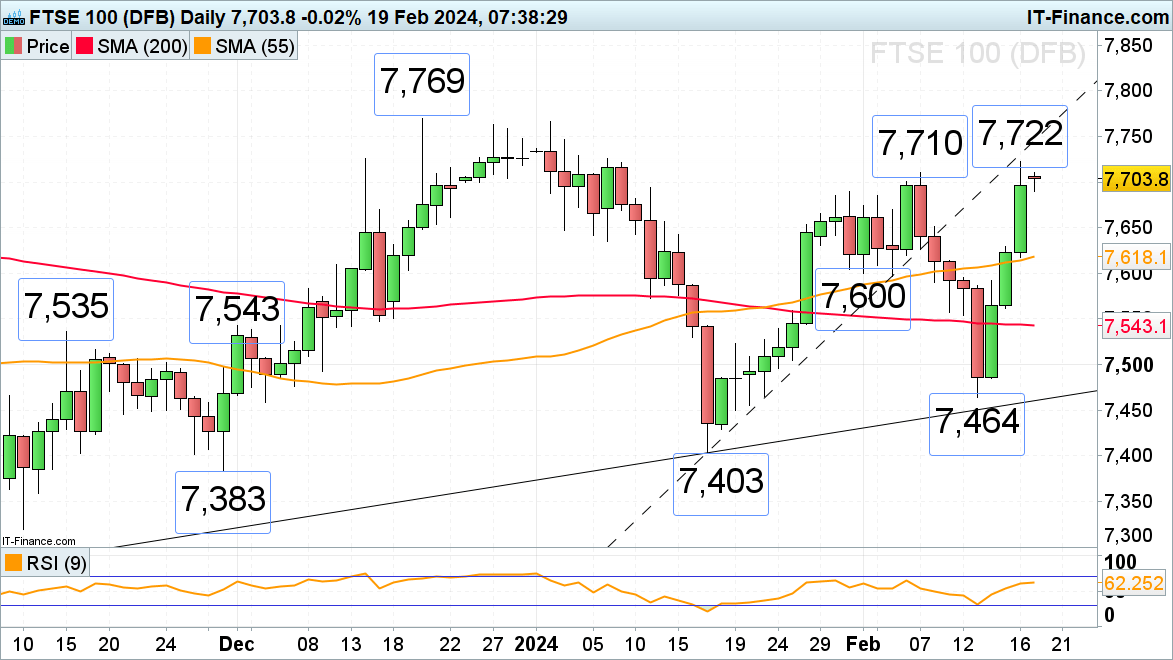
The FTSE 100’s swift rally off last week’s 7,464 low amid positive earnings, softer UK inflation and much stronger-than-expected retail sales and despite the country slipping into a technical recession, has taken the index to 7,722, a near six-week high on Friday.This level remains in play on Monday which is likely to be a quiet one as US markets are shut for its President’s Day.
Minor support below the psychological 7,000 mark is seen along the 55-day simple moving average (SMA) at 7,618.
FTSE100 Daily Chart
See how daily and weekly changes in client sentiment can affect FTSE 100 price action
| Change in | Longs | Shorts | OI |
| Daily | 48% | -32% | -6% |
| Weekly | -24% | 45% | 0% |
DAX 40 retraces lower from last week’s record high
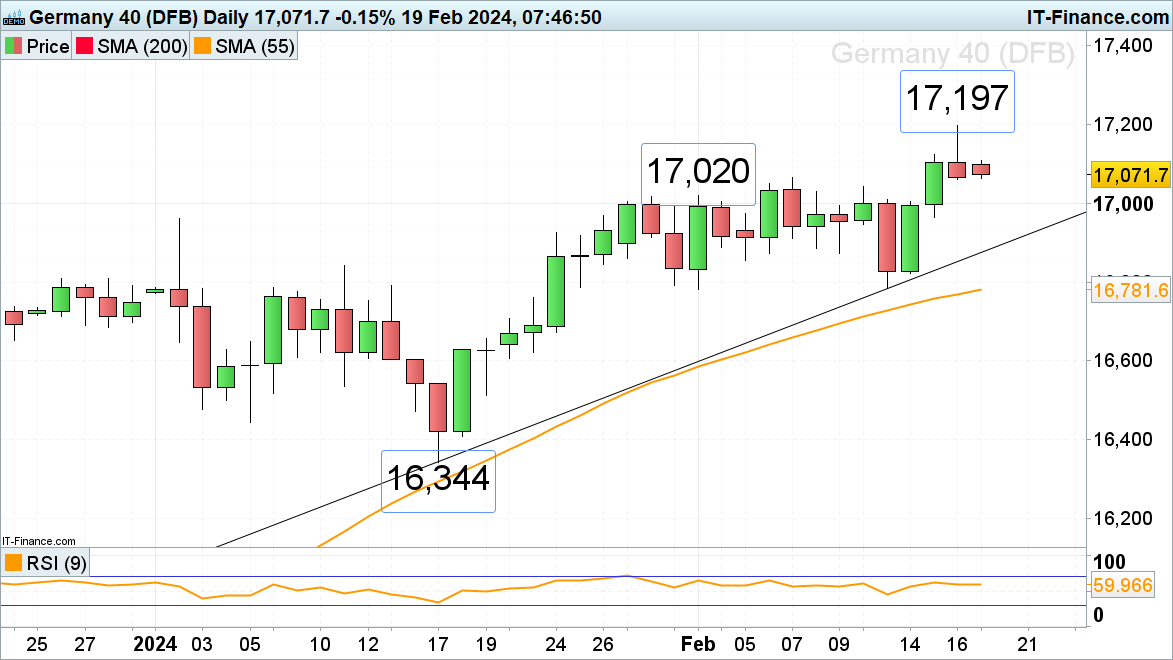
The DAX 40 index is seen coming off last week’s record high at 17,197 and nears Friday’s 17,060 low. If it were to give way, at least a minor top would be formed with the early February high at 17,020 being back in sight, together with the psychological 17,000 mark.
Minor resistance above Monday’s 17,109 intraday high can be found at Thursday’s 17,123 high.
DAX 40 Daily Chart
The Nikkei 225 consolidates below its 34-year high
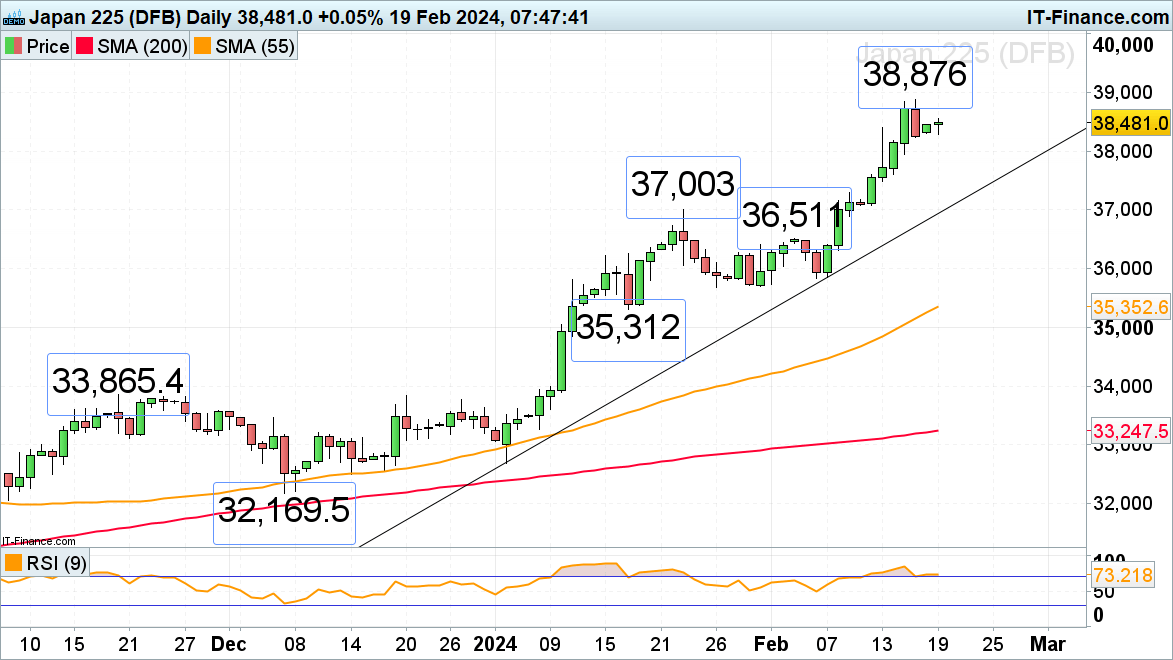
The Nikkei 225’s swift ascent to last week’s 34-year high at 38,876 is taking a breather as the index is short-term consolidating. A rise above 38,876 would put the 1989 record high at 38,957 and also the psychological 40,000 mark on the cards.
Slips may find support at Friday’s 38,239 low, a slip-through which would put the minor 38,000 mark back on the cards.
Nikkei 225 Daily Chart
Download our Complimentary Q1 Equities Forecast
Recommended by Axel Rudolph
Get Your Free Equities Forecast


